By Grant Walker
A college introductory calculus professor once revealed to our class that, despite the public perception, mathematicians are often the laziest people around. The reason that mathematics attracts lazy people, he explained, is because it can provide short-cuts for solving real-world problems: Don’t just count individual things, add or multiply groups of things to get the answer faster! This particular form of laziness, short-cut seeking, was entirely necessary to approach solutions to difficult statistical problems that could otherwise require a lifetime or more of calculations by hand before the existence of computers. At the turn of the 20th century (i.e., 1901), Karl Pearson provided a key short-cut for statistical analysis: the principal component analysis (PCA). While this short-cut has received a lot of critical attention in the literature since then, the pervasiveness of “shoddy” statistical analysis nevertheless threatens to mislead our field with specious findings (Leek & Peng, 2015, Nature). In this post, I will focus specifically on the use and abuse of PCA in in aphasia research.
What’s the problem? Empiricist vs Theorist.
With the rise of fast computers and large datasets, a mythical divide has arisen between theorists and empiricists (Armstrong, 1967). Theorists are seen as far-removed from experiments and data. They read a lot and synthesize and propose thought experiments, deducing conclusions and suggesting avenues for future research. When experimental results conflict with their proposed theories, theorists insist the measurement procedure was flawed. Empiricists, on the other hand, rely on data and statistics, and they simply report what the data tell them. If they are careful in their analysis, no theoretical justification is required. Of course, in practice, this distinction is not so clear-cut. Theories must receive empirical support, or they will wither and die. Meanwhile, experimental designs fundamentally depend on our ideas of what needs to be investigated, and experimental results need to be interpreted with respect to our current best ideas about how things work. Nevertheless, many researchers associate the term data-driven analysis with terms like objective or unbiased rather than with terms like uninformed or decontextualized. Ironically, many advocates for the use of data-driven analyses in science point to the success of machine learning methods in industry, whereas practicing data scientists are constantly emphasizing the importance of content knowledge for building models (i.e., theory or substantive expertise; see Figure 1). Additionally, using PCA to extract factor scores that are intended to be substantively relevant violates the fervent and repeated pleas of statisticians not to use it this way (see References), thereby exhibiting a lack of math and statistics knowledge and placing this method squarely in the Danger Zone! (Figure 1)

Figure 1. The data science Venn diagram (www.drewconway.com).
“In these studies, where the data stand alone and speak for themselves, my impression is that it would be better had the studies never been published. The conclusion that ‘this factor analytic study has provided a useful framework for further research’ may not only be unsupported-it may also be misleading . . . If [PCA] is used for generating hypotheses without an explicit a priori hypothesis, the world will soon be overrun by hypotheses.” (Armstrong, 1967)
What is PCA and why do people use it?
PCA shares some conceptual foundations with the more familiar ordinary least-squares (OLS) linear regression analysis. In fact, when there are only two measurements of multiple individuals, PCA and OLS yield identical solutions. If a researcher has multiple measurements of multiple individuals, then each individual can be represented as a point in a multi-dimensional measurement space, with each measurement value acting as a coordinate system. The 1st principal component is defined as the line passing through the cloud of points that yields the smallest average distance between the points and the line (i.e., the least squared-error). The 2nd component is defined as the line crossing the 1st component at a 90-degree angle (i.e., orthogonally) through the origin (i.e., the coordinates represented by the average of each measurement) that again yields the smallest distance between the points and this new line. This procedure is repeated until a number of orthogonal lines is drawn equal to the number of original measurements. Due to the iterative procedure, each of these lines explains a fraction of the total variance of measurements in descending order. Typically, the bulk of the variance of measurements is explained by just a few of the initial components, while the remaining components account for small, perhaps negligible, fractions of variance. Some researchers then take a further step of claiming that these initial components are meaningful measures; they assume these are the “important” dimensions that individuals vary along.
Many researchers mistakenly believe that PCA is a latent variable model. Latent variable models explain manifest variables (i.e., measurements) as a reflection of underlying variables that are not directly measurable. For example, the test scores from exams in any content area may depend on a single underlying quantity of general intelligence. Alternatively, test scores from algebra and calculus exams may depend on quantitative reasoning ability, while test scores from vocabulary and reading comprehension exams may rely on verbal reasoning ability, completely independent from quantitative reasoning ability. Rather than examining each test score separately, researchers may be tempted to build a model based on their assumptions (e.g., general intelligence or specific abilities) and use it to quantify these underlying abilities that can then generalize to any test scores that depend on them. These latent ability scores are supposed to be more robust and valid than the individual test scores, which are contaminated with measurement variance due to idiosyncratic measurement procedures. If a researcher does not have a specific theory about the relationship between mental abilities and test scores, it may be possible to derive the number of mental abilities underlying a set of test scores based on their patterns of correlation. Exploratory factor analysis (EFA), which attempts to parcellate variance in a set of measurements into common latent variables and unique measurement errors, is often confused with PCA, which produces a composite of all manifest variables that maximally accounts for their total variance, regardless of measurement noise. While both of these methods can be useful for data reduction (i.e., lossy compression) or hypothesis formation about the number of latent variables underlying a set of measurements, neither of these procedures is appropriate for quantifying the individual factor scores (i.e., ability levels); structural equation modeling (SEM), an inherently theoretical approach, is the recommended method to achieve this goal (Preacher & MacCullum, 2003).
It might be appropriate to use PCA if a researcher is given a set of test scores for a set of individuals without any identification of which tests were performed, and the researcher’s goal is to provide their best estimate of how many different abilities were actually measured by these different tests. The researcher still would not know which abilities were measured, only a guess as to how many were measured. Clearly, this is not a typical circumstance in research or the clinic. Crucially, it is not appropriate to use PCA or EFA to estimate the levels of abilities underlying a set of test scores, even if the true number of factors is successfully recovered by the analysis. There are many violations of best practices for determining the number of factors underlying a set of test scores from aphasia assessment batteries in the literature (see References); the misuse of PCA or EFA to further assess ability levels is a separate issue that is compounded by these preliminary pitfalls.
PCA in Aphasia Research: Violating Best Practices
If PCA comes with all of these caveats, why does it continue to be so compelling to some researchers? If PCA merely produced random noisy results, it would quickly be abandoned. The dangers of PCA are more insidious; perhaps it is best thought of as the worst plausible model. (Short-cut, remember?) With just the right amount of imagination, researchers can convince themselves that their PCA factor scores have adequately captured something important, and perhaps they do. But it is also important to remember that, if one believes in the existence of measurement noise, then the PCA scores are inherently contaminated in a way that violates our understanding of the sources of variance in the data. It is a questionable definition of mental ability from the start. One might be tempted to argue that individual measurements are also contaminated with measurement noise, but traditional statistical analyses (e.g., ANOVA) are intended to appropriately account for this type of noise, rather than indiscriminately lumping it in with our variables of interest. It is also important to remember that there is absolutely no rigor in deciding what constructs the factor scores are representing, nor, typically, is there any demonstration that these factor scores are indeed more reliable, robust, or valid than individual measurements. When researchers say that they have “replicated” a factor structure (see References), typically, no statistical evidence is provided in support. What a failure-to-replicate might look like is never defined; no criterion for “similarity” is ever discussed; the differences in solutions are arbitrarily trivialized; and we should remember that a reproducible error is still an error. Furthermore, the repeated analysis of the same data introduces a new violation of recommended best practices. Confirmatory factor analysis should be performed on entirely different data than an exploratory factor analysis, or else claims of “replicability” are rather trivial. Most researchers would not accept that adding a few more observations to a previously published analysis and re-running it counts as a new analysis worthy of publication. Thus, any claims that factor scores derived from PCA represent useful and interpretable measurements of mental abilities should be viewed with extreme skepticism until independent evidence (i.e., a demonstration) is provided in support. A critical eye should examine PCA results for violations of known boundaries in the real world.
Toy Example
Let’s make things concrete. Many people have a geometric or spatial interpretation of PCA, often imagining something like a PCA recovering the principal axes of a surfboard. So, let’s imagine a small town with 100 people, who each have a cell phone that transmits their 3D coordinates in latitude, longitude, and altitude. This town has 3 roads, 3 housing units, and 3 office buildings. Each person is always in one and only one of these mutually exclusive structures. If they are on the road, then they have zero altitude; if they are in a housing unit, then they can be on one of 3 possible floors that define their altitude; if they are in an office building, then they can be on one of 10, 20, or 30 possible floors that define their altitude, respectively. We wish to condense the 3 spatial coordinates into 2 variables per person. First, we can ignore everything we know about the structure of the town and submit the spatial coordinates to a PCA, retaining scores on the first 2 principal components for each person. Alternatively, we can use one number to indicate which structure the person is in (i.e., a non-linear categorization) and another number to indicate the relative length along the road or the relative height within the building, while assuming the central coordinates of the structure provide an approximation to the person’s remaining coordinates in the 2D plane. This example is illustrated in Figure 2, with the top and bottom rows showing different views of the town and its inhabitants. The left column shows the original coordinates of each person, the middle column shows the projected coordinates from the first 2 principal components, and the third column shows the projected coordinates from the theoretical model of how a person’s spatial location depends on the town’s structural boundaries.
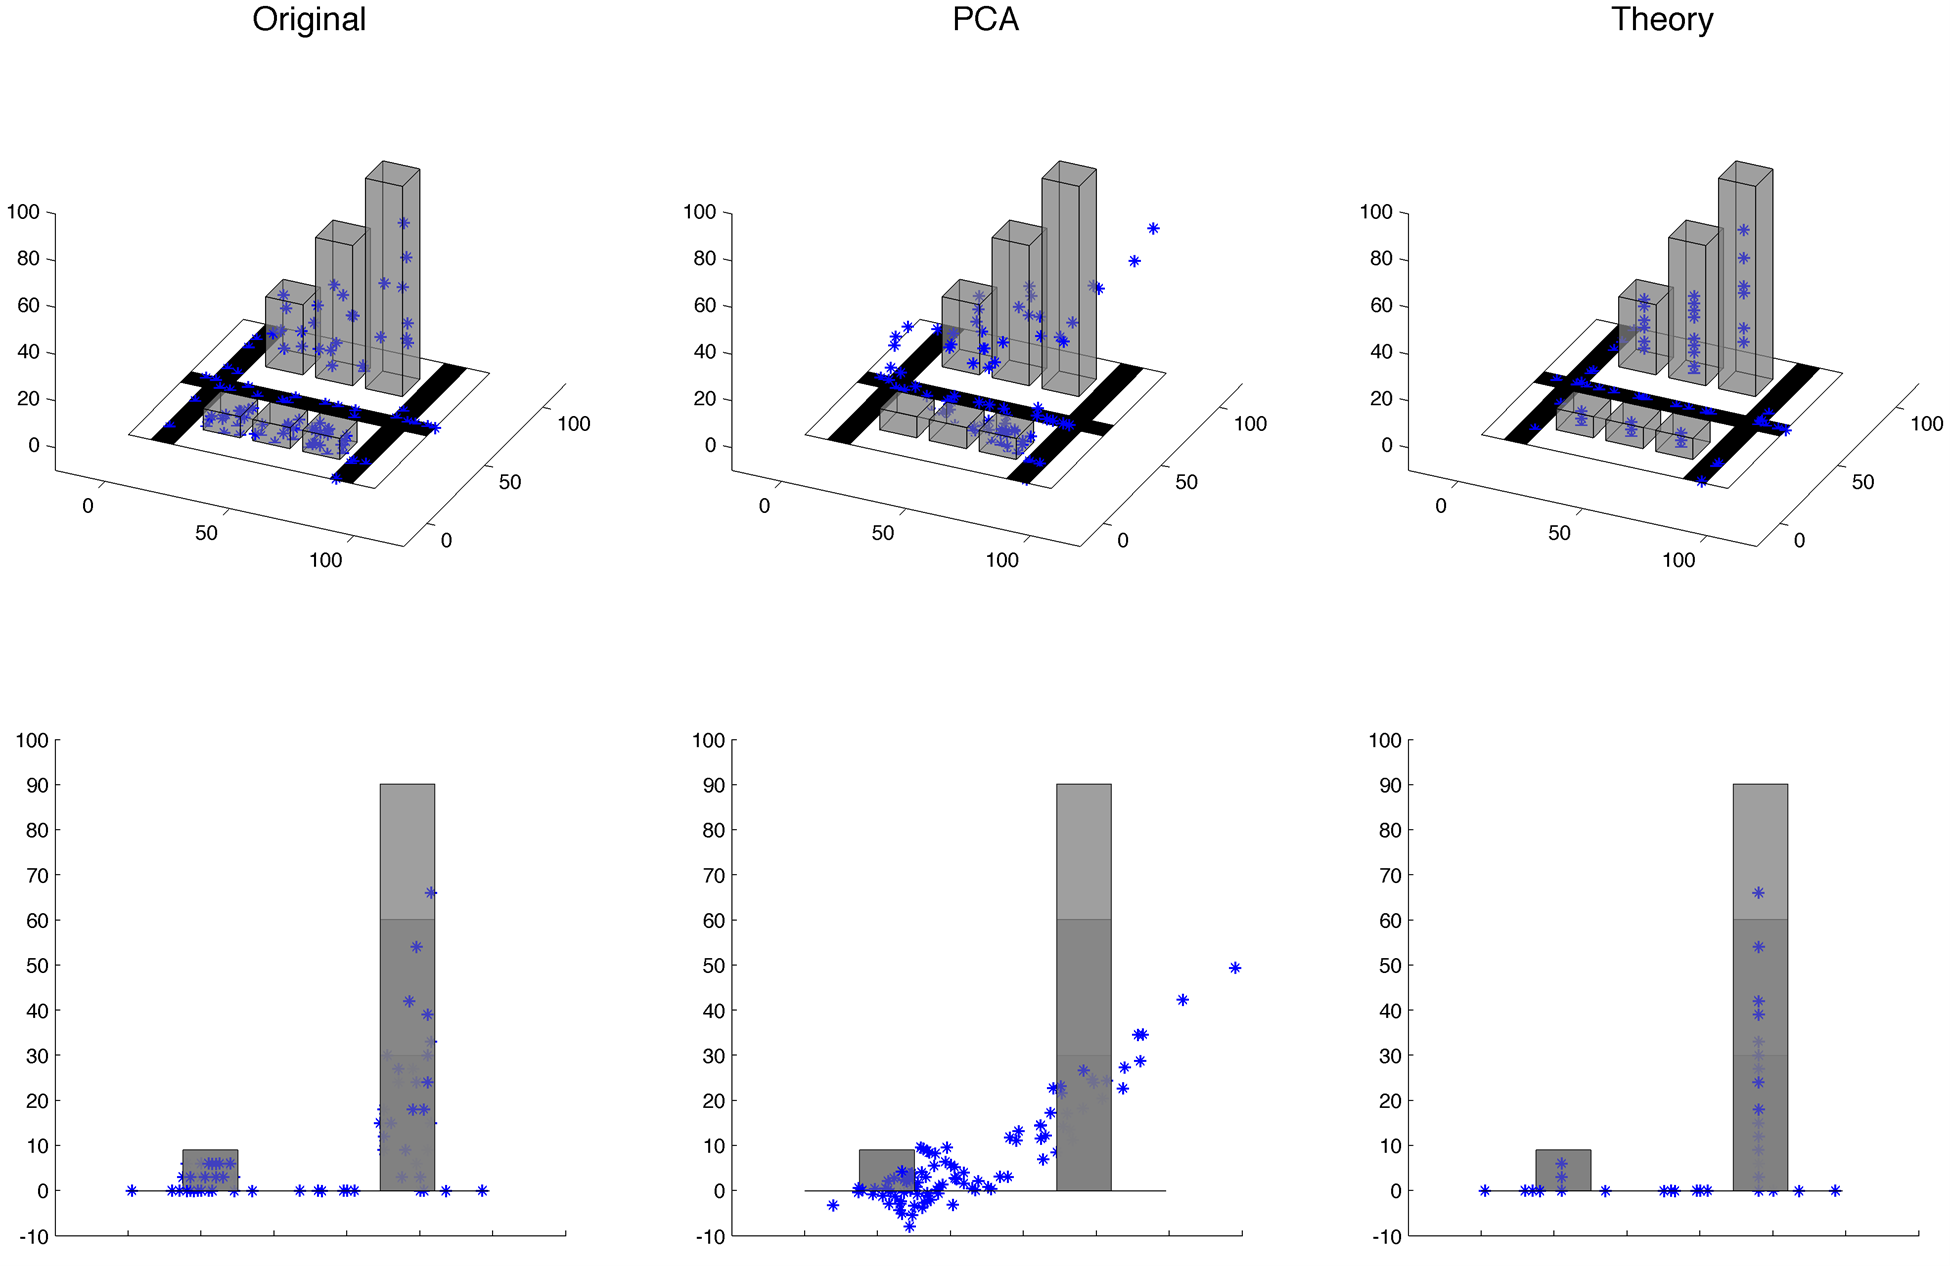
Figure 2. A small town with 3 roads, 3 housing units, 3 office buildings, and 100 people (blue asterisks). The top and bottom rows show the same town and spatial coordinates of each person from different angles. The first column shows the original coordinates; the second column shows the coordinates that are derived from the 1st two principal components of the original coordinates; the third column shows the coordinates that are derived from a 2-factor, theoretical model based on the structural components of the town. Download MATLAB code for this example.
The first 2 principal components each have an eigenvalue greater than 1, and together they account for 86% of the variance in spatial coordinates. These are typical statistics that are provided in support of a successful analysis. When the PCA coordinates are projected back into the original spatial coordinates, the average distance (root mean square error, in arbitrary units) from the new coordinates to the original coordinates is 6.0, ranging [0.1, 23.6]. The PCA model appears to capture much more information than randomly guessing coordinates, which results in an average error of 40.6, ranging [2.1 to 83.1]. By contrast, when the variables of the theoretical model are projected back into the original spatial coordinates, the average distance is 3.0, ranging [0.0, 5.3]. Notice that the maximum error from the theoretical model is still less than the average error from PCA. Furthermore, when viewed from an angle that emphasizes the boundaries of the town’s structures, it is clear that the PCA projection leads to absurd violations of our understanding of the town’s structural boundaries. Also note that the values of the first two principal components are abstract and essentially meaningless (e.g., [2.1, ‑0.4]), whereas the values of the theoretical variables can be interpreted immediately (e.g., [structure 4, 33% altitude]). Finally, note that the theoretical model can immediately be applied to a new set of data and be expected to perform about as well as it did with the first set of data. On the other hand, PCA on a new set of data may yield a completely different model, and using the derived principal axes from the first set of data to encode a new set of data will further deteriorate the match between the projected and the original coordinates.
Conclusion
Given that we already know so much about the structural boundaries of the brain and the mind, do we really want to abandon all this hard-won knowledge as we build our models of aphasia? For example, if PCA on a test battery that is designed to evaluate input phonology and output phonology suggests only a single phonological factor (e.g., Butler et al., 2014), should we assume that output phonology can be adequately assessed with only tests of input phonology since they load on the same factor? That would be absurd. We should not pretend that these are the same thing, nor that they are two completely independent things, just so we can shoehorn our data into the PCA model. Instead, a structural equation model (or latent variable model) can enforce our assumptions that these are two different, but often related, constructs to be measured (or even that there is a hierarchical organization that includes a common factor as well as unique factors). Lesion-symptom brain mapping will then directly benefit from appropriately defined dependent variables.
References
The following references recycle data for repeated PCA of behavioral measures:
Butler, R. A., Lambon Ralph, M. A., & Woollams, A. M. (2014). Capturing multidimensionality in stroke aphasia: mapping principal behavioural components to neural structures. Brain, 137(12), 3248-3266.
N = 31
Halai, A. D., Woollams, A. M., & Ralph, M. A. L. (2017). Using principal component analysis to capture individual differences within a unified neuropsychological model of chronic post-stroke aphasia: revealing the unique neural correlates of speech fluency, phonology and semantics. Cortex, 86, 275-289.
N = 31
Woollams, A. M., Halai, A., & Ralph, M. A. L. (2018). Mapping the intersection of language and reading: the neural bases of the primary systems hypothesis. Brain Structure and Function, 223(8), 3769-3786.
N = 43
Alyahya, R. S., Halai, A. D., Conroy, P., & Ralph, M. A. L. (2018). Noun and verb processing in aphasia: Behavioural profiles and neural correlates. NeuroImage: Clinical, 18, 215-230.
N = 48
Halai, A. D., Woollams, A. M., & Ralph, M. A. L. (2018). Triangulation of language-cognitive impairments, naming errors and their neural bases post-stroke. NeuroImage: Clinical, 17, 465-473.
N = 51
Tochadse, M., Halai, A. D., Ralph, M. A. L., & Abel, S. (2018). Unification of behavioural, computational and neural accounts of word production errors in post-stroke aphasia. NeuroImage: Clinical, 18, 952-962.
N = 53
Zhao, Y., Ralph, M. A. L., & Halai, A. D. (2018). Relating resting-state hemodynamic changes to the variable language profiles in post-stroke aphasia. NeuroImage: Clinical, 20, 611-619.
N = 66
Conroy, P., Sotiropoulou Drosopoulou, C., Humphreys, G. F., Halai, A. D., & Lambon Ralph, M. A. (2018). Time for a quick word? The striking benefits of training speed and accuracy of word retrieval in post-stroke aphasia. Brain, 141(6), 1815-1827.
N = 70
Halai, A. D., Woollams, A. M., & Ralph, M. A. L. (2018). Predicting the pattern and severity of chronic post-stroke language deficits from functionally-partitioned structural lesions. NeuroImage: Clinical, 19, 1-13.
N = 70
Schumacher, R., Halai, A. D., & Lambon Ralph, M. A. (2019). Assessing and mapping language, attention and executive multidimensional deficits in stroke aphasia. Brain, 142(10), 3202-3216.
N = 38
Alyahya, R. S., Halai, A. D., Conroy, P., & Ralph, M. A. L. (2020). Mapping psycholinguistic features to the neuropsychological and lesion profiles in aphasia. cortex, 124, 260-273.
N = 42
Alyahya, R. S., Halai, A. D., Conroy, P., & Lambon Ralph, M. A. (2020). A unified model of post-stroke language deficits including discourse production and their neural correlates. Brain, 143(5), 1541-1554.
N = 56
Zhao, Y., Halai, A. D., & Lambon Ralph, M. A. (2020). Evaluating the granularity and statistical structure of lesions and behaviour in post-stroke aphasia. Brain Communications, 2(2), fcaa062.
N = 70
Halai, A. D., Woollams, A. M., & Ralph, M. A. L. (2020). Investigating the effect of changing parameters when building prediction models for post-stroke aphasia. Nature Human Behaviour, 1-11.
N = 70
Ingram, R. U., Halai, A. D., Pobric, G., Sajjadi, S., Patterson, K., & Lambon Ralph, M. A. (2020). Graded, multidimensional intra-and intergroup variations in primary progressive aphasia and post-stroke aphasia. Brain.
N = 76
The following references are considered to be influential PCA studies from other research groups:
Kümmerer, D., Hartwigsen, G., Kellmeyer, P., Glauche, V., Mader, I., Klöppel, S., … & Saur, D. (2013). Damage to ventral and dorsal language pathways in acute aphasia. Brain, 136(2), 619-629.
Lacey, E. H., Skipper-Kallal, L. M., Xing, S., Fama, M. E., & Turkeltaub, P. E. (2017). Mapping common aphasia assessments to underlying cognitive processes and their neural substrates. Neurorehabilitation and Neural Repair, 31(5), 442-450.
Mirman, D., Chen, Q., Zhang, Y., Wang, Z., Faseyitan, O. K., Coslett, H. B., & Schwartz, M. F. (2015). Neural organization of spoken language revealed by lesion–symptom mapping. Nature communications, 6(1), 1-9.
Mirman, D., Zhang, Y., Wang, Z., Coslett, H. B., & Schwartz, M. F. (2015). The ins and outs of meaning: Behavioral and neuroanatomical dissociation of semantically-driven word retrieval and multimodal semantic recognition in aphasia. Neuropsychologia, 76, 208-219.
The following references provide critical perspectives on PCA:
Armstrong, J. S. (1967). Derivation of theory by means of factor analysis or Tom Swift and his electric factor analysis machine. The American Statistician, 21(5), 17-21.
Cronkhite, G., & Liska, J. R. (1980). The judgment of communicant acceptability. Persuasion: New directions in theory and research, 101-139.
Fabrigar, L. R., Wegener, D. T., MacCallum, R. C., & Strahan, E. J. (1999). Evaluating the use of exploratory factor analysis in psychological research. Psychological methods, 4(3), 272.
Leek, J. T., & Peng, R. D. (2015). Statistics: P values are just the tip of the iceberg. Nature, 520(7549), 612-612.
Preacher, K. J., & MacCallum, R. C. (2003). Repairing Tom Swift’s electric factor analysis machine. Understanding statistics: Statistical issues in psychology, education, and the social sciences, 2(1), 13-43.
Walker, G. M. (2019). Applications of psychometric methods to neuropsychological models of speech and language. In D. J. McFarland (Ed.), General and Specific Mental Abilities (pp. 412–435). Newcastle upon Tyne, UK: Cambridge Scholars Publishing. https://psyarxiv.com/ypzv5